What does ETF analysis reveal about the performance of market leaders,sector averages, and followers, and about overall market concentration? How does survivorship bias impact the validity of our conclusions, and what steps can be taken to reduce its effects? Which time window should be analyzed?
Introduction
This analysis explores the long-term performance dynamics between two distinct investment approaches within the NASDAQ market: Value-Weighted (ETFs) and Equally-Weighted Portfolios.
Beyond a simple performance comparison, this study serves as a proxy for understanding market structure:
Market Leaders (ETFs)
Value-weighted indices give more importance to large firms, representing the dominance of market giants.
Market Followers (Equally-Weighted)
By treating every company the same regardless of size, these portfolios capture the collective behavior of the broader market, including small and mid-sized firms.
We apply this comparative framework at two levels:
Global Analysis
Comparing a general value-weighted benchmark against a comprehensive Equally-Weighted portfolio of all eligible NASDAQ stocks to assess overall market drivers.
Sector Analysis
Focusing on four major sectors (Health Care, Finance, Technology, Consumer Services) to see if these patterns hold true across different industries.
Key Question: Is market performance primarily driven by the concentrated power of a few “Leaders”, or does the diversified strength of the “Followers” provide a superior edge?
Methodology
🔬 Our Approach: We compare two investment philosophies using rigorous data science to understand whether market performance is driven by a handful of giants or by the collective strength of the broader market.
1. Conceptual Framework: Leaders vs. Followers
Market Leaders
Value-Weighted (ETFs)
Weights proportional to market cap. Performance driven by large-cap firms.
Market Followers
Equally-Weighted (Portfolios)
Equal weight (1/n) for every company. Captures broader market participation.
📊 Interpretation Logic:
• If ETF > Equally-Weighted → Leaders dominate (concentration wins)
• If Equally-Weighted > ETF → Followers outperform (breadth wins)
2. Data Sources & Preparation
📂 Dataset #1: NASDAQ Company List
Metadata including Sector, Industry, and Market Cap to classify firms.
📈 Dataset #2: Stock Market Data
Daily price data (Open, Close, Adjusted Close) to compute returns.
🔧 Data Cleaning Rules
Time Period:
15 years (2005–2020)
Inclusion Criteria:
2+ years historical data (2,074 stocks)
Outlier Handling:
Daily returns clipped at ±50%
Quality Check:
Remove data errors & anomalies
3. Portfolio Construction
📌 Equally-Weighted Portfolios
📌 ETF Benchmarks
4. Limitations: Survivorship Bias
The Survivorship Bias Challenge
Our NASDAQ dataset includes only companies listed in 2020. Firms that went bankrupt, were delisted, or merged before 2020 are excluded. This primarily affects small and mid-cap firms and may lead to:
5. Global & Sector Benchmarks
6. Performance Metrics
Annualized Returns
Geometric average of yearly growth rates.
Volatility
Annualized standard deviation of daily returns.
Sharpe Ratio
Risk-adjusted performance measure.
Cumulative Returns
Total growth over the 15-year period.
Global Market Analysis
We begin with an overview of the entire NASDAQ market, comparing the Fidelity Nasdaq Composite Index Tracking Stock (ONEQ) against our Equally-Weighted Global Portfolio (composed of 2,074 stocks).
Use the dropdown menu below to explore how this relationship changes over different time horizons:
Over this 15-year period, the equally-weighted portfolio (EW) demonstrates the power of "Market Breadth". While the ETF (ONEQ) is driven by a handful of giants, the EW benefits from the explosive growth of mid-caps during recovery phases (2009-2013), building a lead that allows it to withstand the late dominance of Big Tech. Note: Due to the long duration, these results might be partially influenced by Survivorship Bias.
Temporal Dynamics: The 2015 Regime Shift
To understand exactly when and why market leadership changed, we combined a discrete time-period breakdown with a rolling window analysis. Both methods point to a structural pivot in the middle of the last decade.
1. Discrete Period Analysis
We first broke down returns into four distinct market phases. The interactive visualizations below highlight the dramatic reversal in fortune across different time periods:
| Period | ETF Return | EW Return | Difference | Market Context |
|---|---|---|---|---|
| 2005-2008 | -6.89% | 0.77% | +7.66% | Pre-crisis period |
| 2009-2012 | 17.45% | 32.56% | +15.11% | Post-crisis recovery |
| 2013-2016 | 15.89% | 19.62% | +3.74% | Mid-bull market |
| 2017-2020 | 10.90% | -3.99% | -14.89% | Late bull & COVID |
2. Rolling Window Visualization
The reversal is even more apparent when viewed dynamically. The chart below shows the rolling 2-year return difference, pinpointing the “Regime Shift” specifically to the 2014-2016 period.
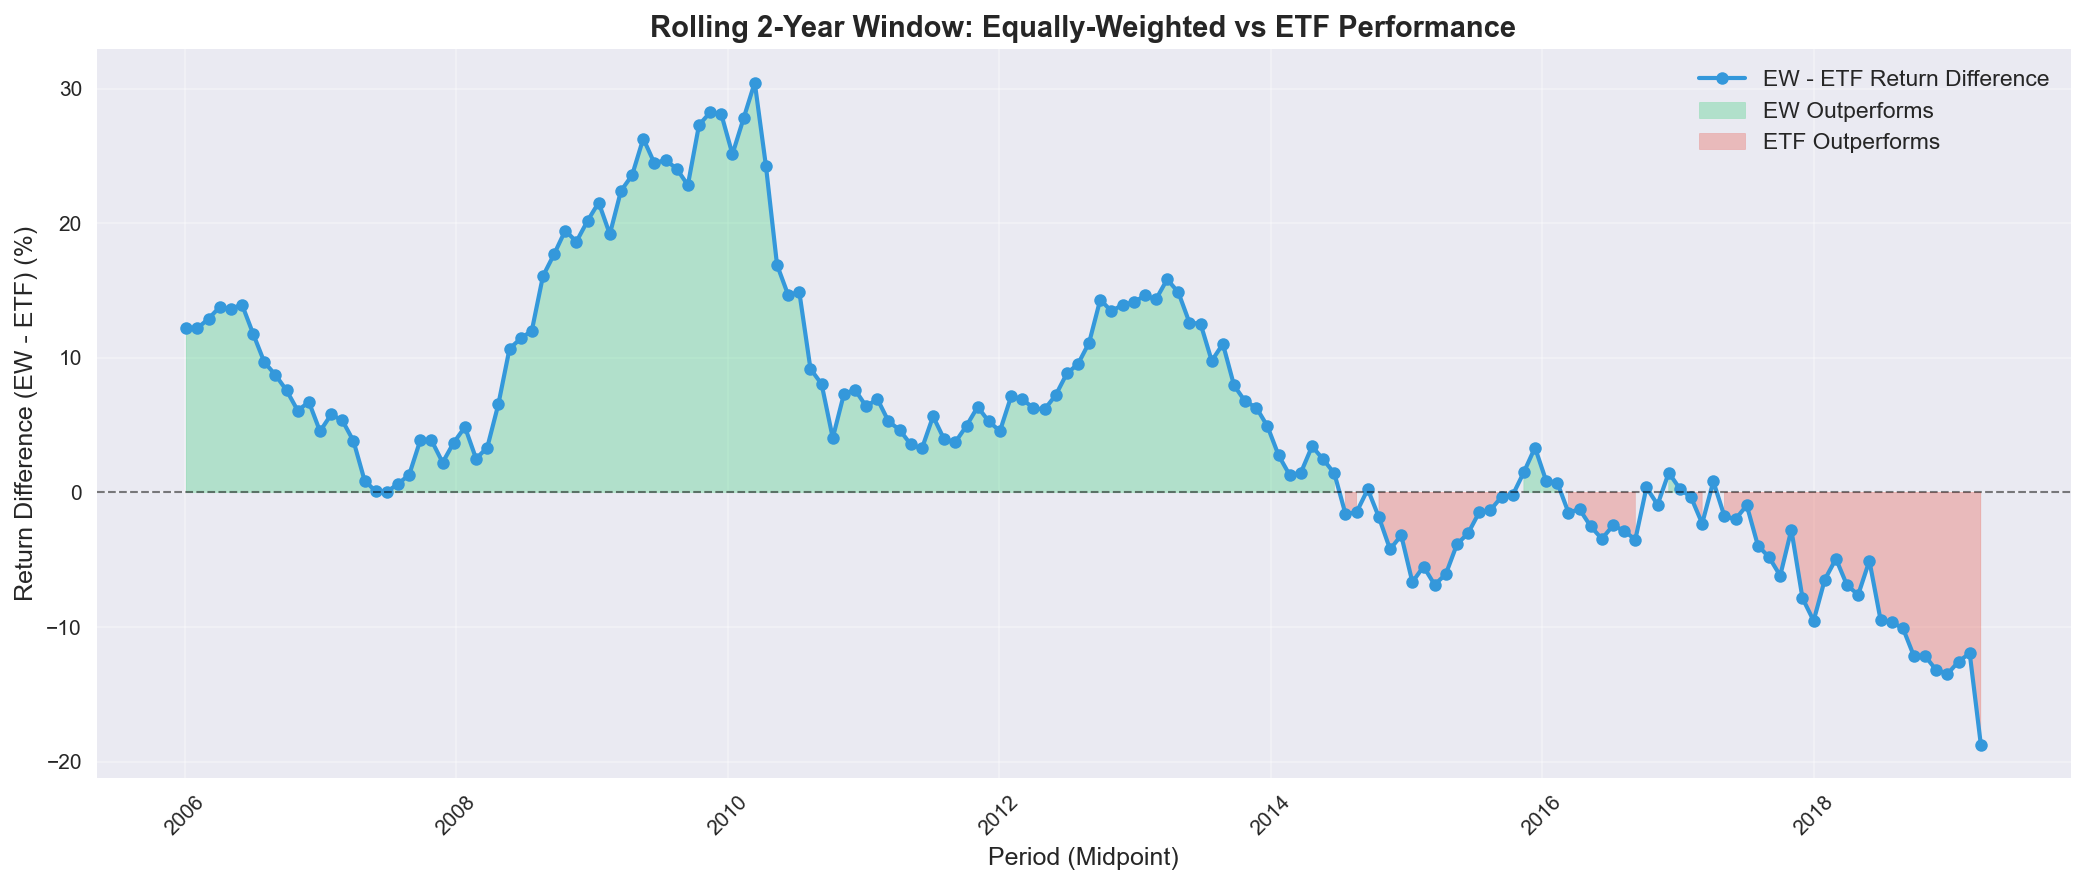 Rolling 2-year returns comparison. Green areas indicate periods where the Equally-Weighted portfolio (Followers) outperformed.
The “Pivot Point” (2014-2016):
- The “Breadth” Era (2009–2014): Post-crisis recovery was broad-based. Small and mid-cap companies (“Followers”) grew faster than established giants. This was a “stock picker’s market.”
- The “Concentration” Era (2015–2020): A clear regime shift occurred around 2015. Investors flocked to “Safe Haven” mega-caps (GAFAM), causing the standard ETF to outperform significantly while the average stock lagged behind.
Sector-by-Sector Analysis
Health Care Sector (IBB)
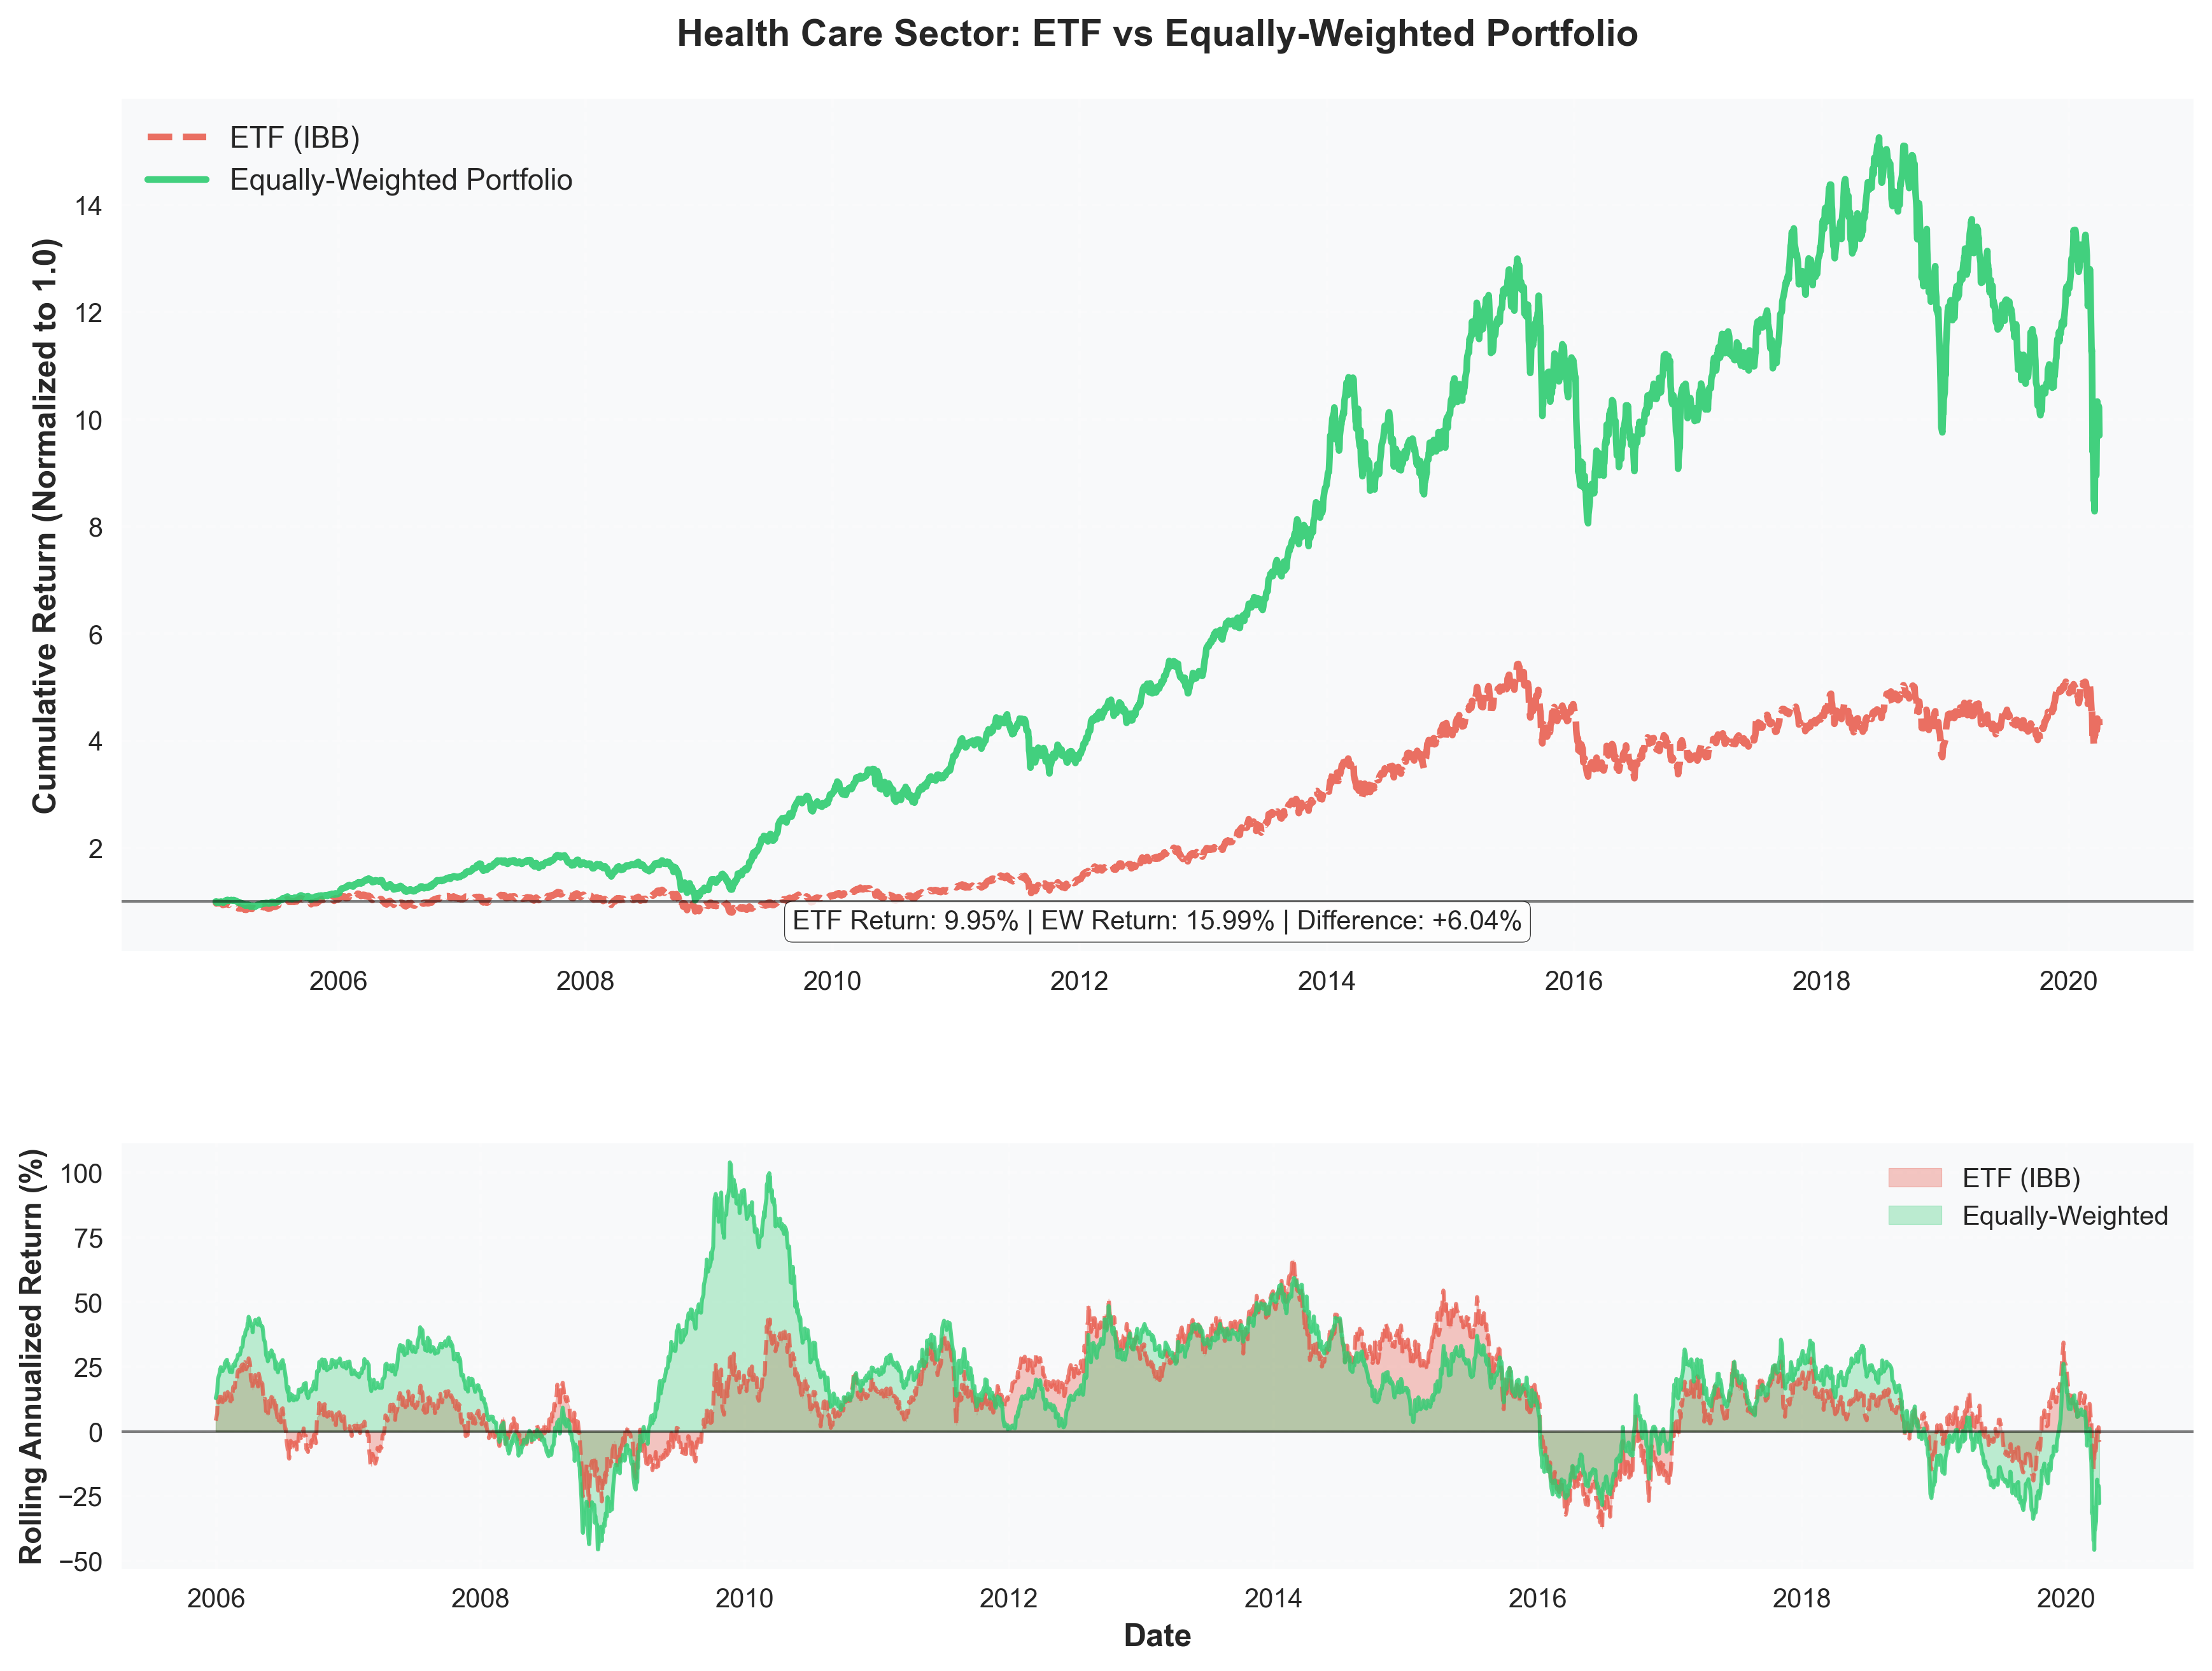
Performance Highlights:
- Equally-Weighted Return: 15.99% annually
- ETF Return: 9.95% annually
- Outperformance: +6.04% in favor of EW portfolio
- Sharpe Ratio: EW (0.78) vs ETF (0.42) - 86% better risk-adjusted returns
Insights: The Health Care sector shows the strongest outperformance of equally-weighted portfolios. With 564 stocks analyzed, the diversification benefits are clear. The biotech and pharmaceutical industries have significant variation between large-cap leaders and smaller innovative companies, allowing equally-weighted portfolios to capture growth across the entire sector spectrum.
Key Observations:
- EW portfolio showed remarkable resilience during market downturns
- Consistent outperformance throughout the 15-year period
- Higher volatility in EW portfolio was more than compensated by superior returns
Finance Sector (FTXO)
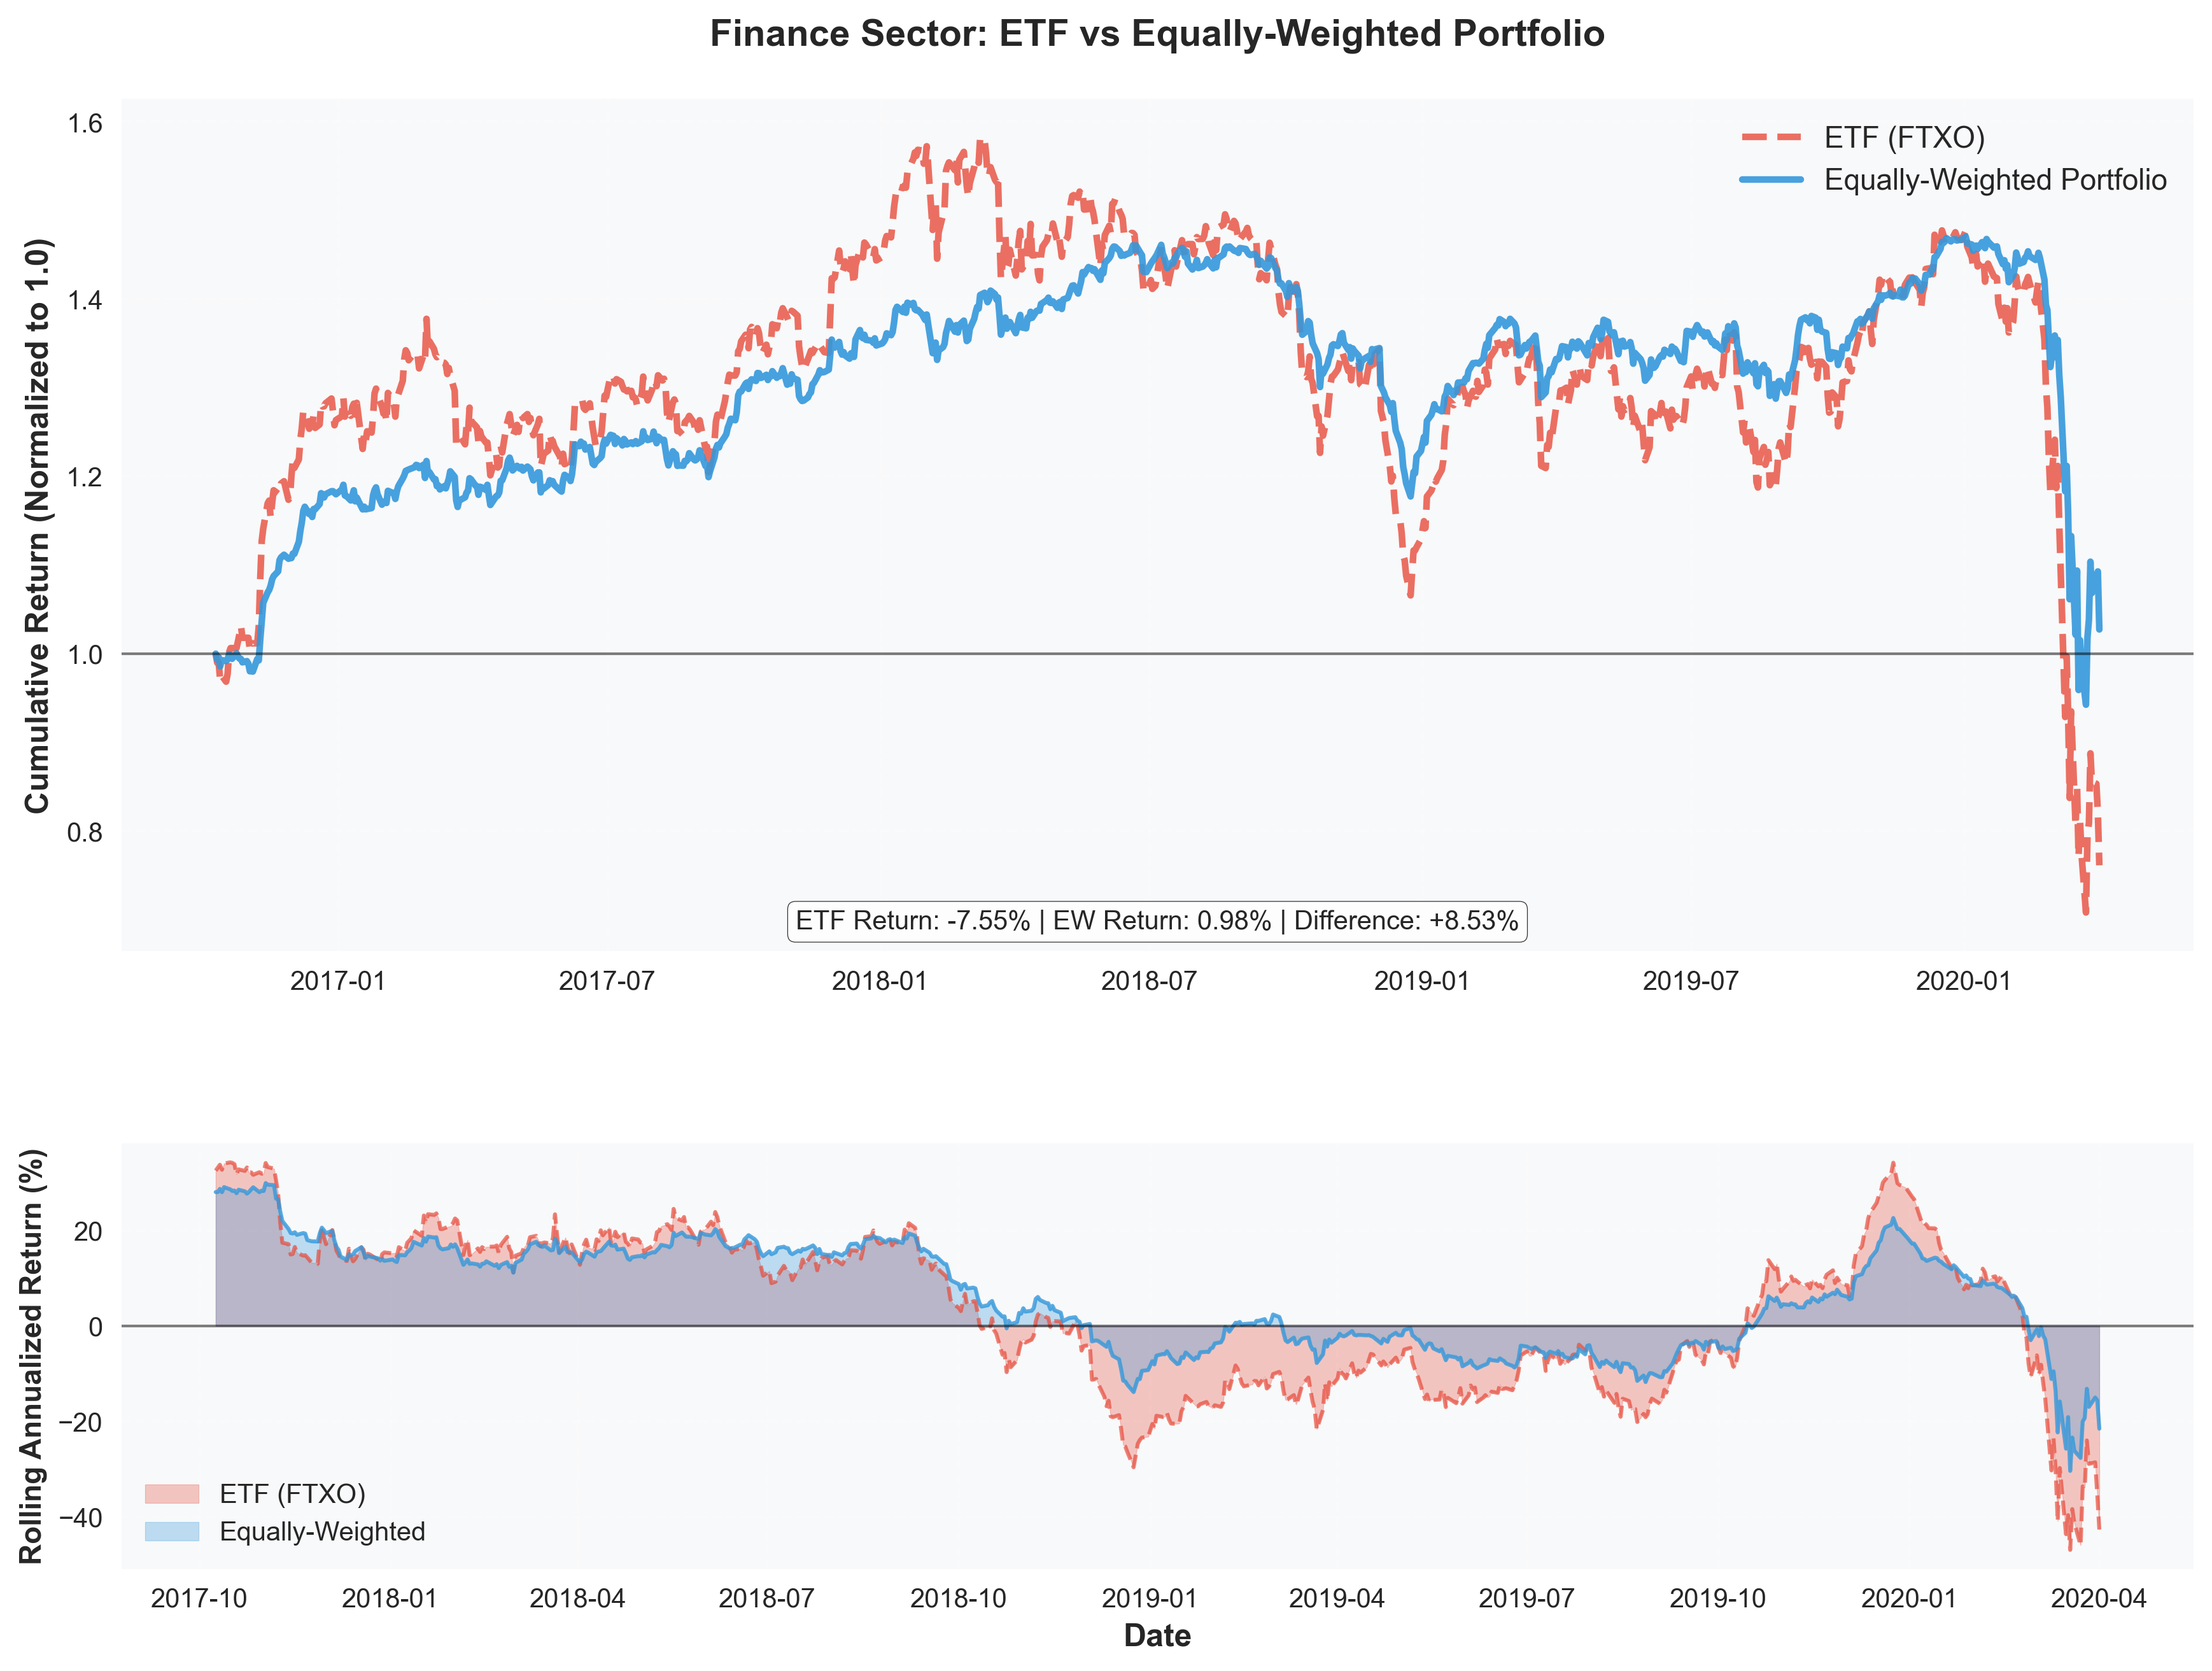
Performance Highlights:
- Equally-Weighted Return: 0.98% annually
- ETF Return: -7.55% annually
- Outperformance: +8.53% in favor of EW portfolio
- Sharpe Ratio: EW (0.05) vs ETF (-0.27) - ETF had negative risk-adjusted returns
Insights: The Finance sector tells a dramatic story. The 2008 financial crisis devastated large financial institutions (heavily weighted in the ETF), while the equally-weighted portfolio, by diversifying across 484 financial stocks, managed to stay positive. This is a powerful demonstration of how equal weighting can protect against sector-specific crises that disproportionately affect market leaders.
Key Observations:
- Both portfolios struggled during 2008-2009 financial crisis
- EW portfolio recovered faster and maintained positive returns
- ETF remained below initial investment value for most of the period
- Largest outperformance difference among all sectors
Technology Sector (QTEC)
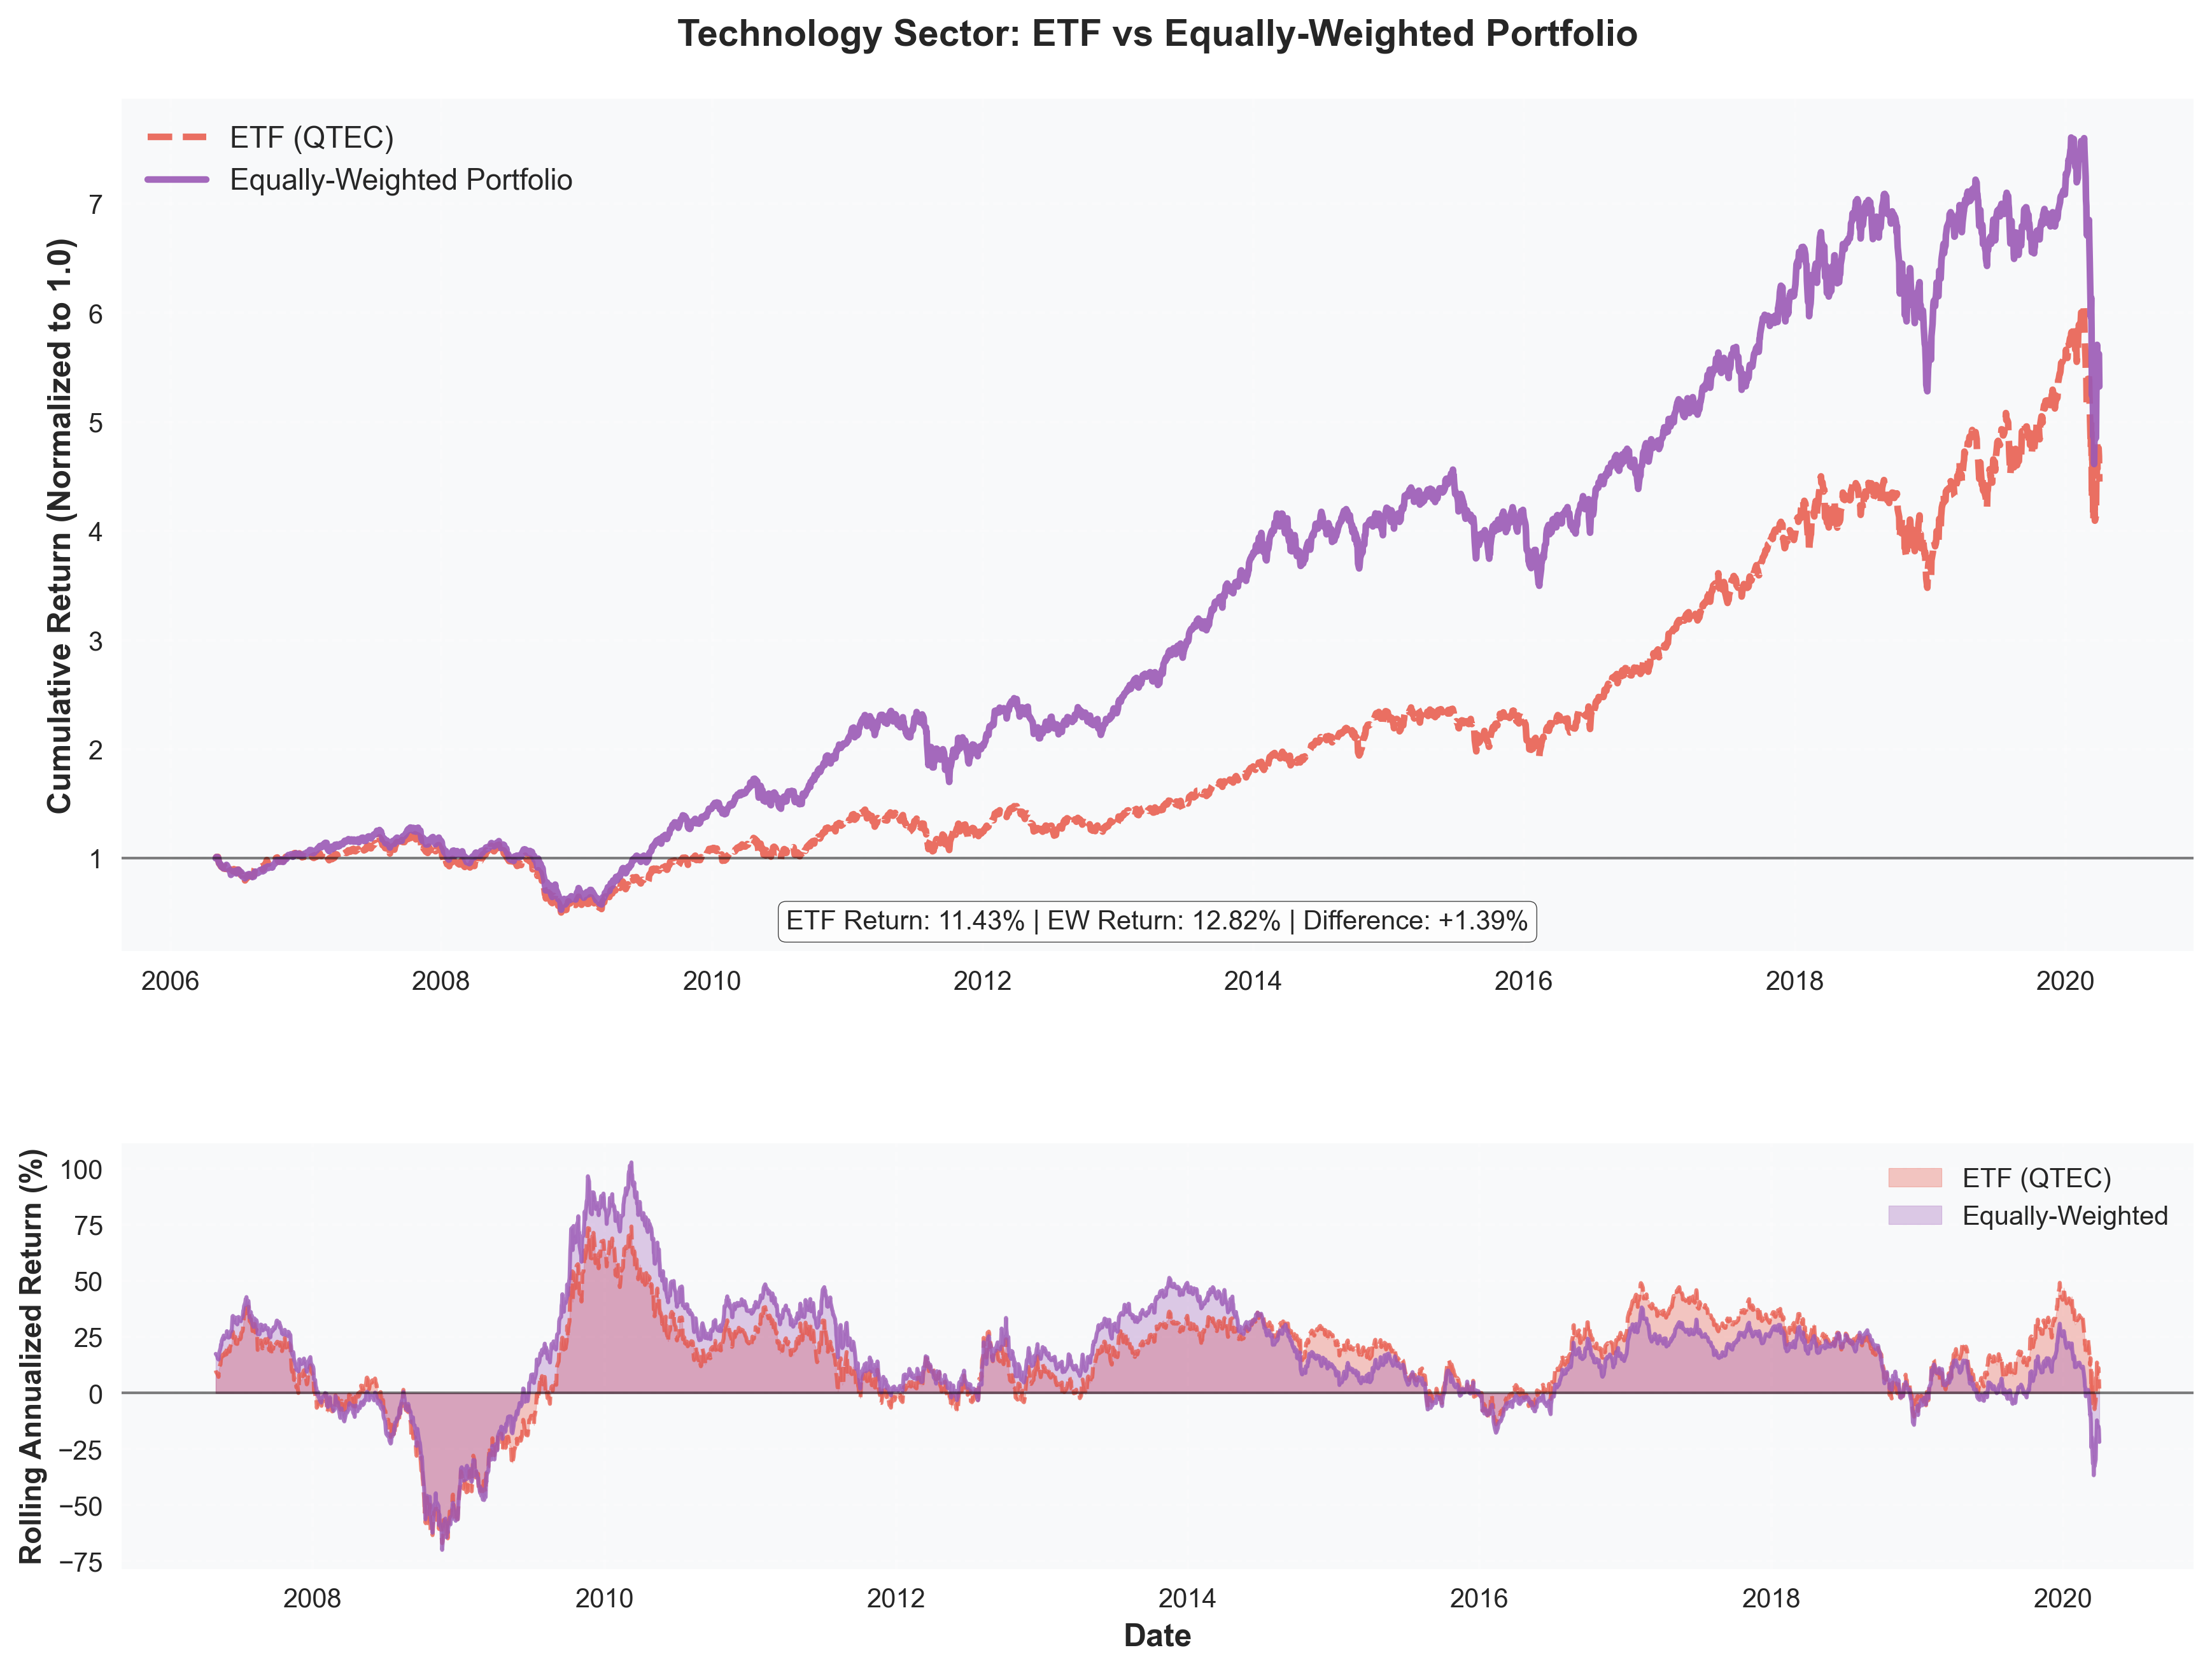
Performance Highlights:
- Equally-Weighted Return: 12.82% annually
- ETF Return: 11.43% annually
- Outperformance: +1.39% in favor of EW portfolio
- Sharpe Ratio: EW (0.59) vs ETF (0.47) - 26% better risk-adjusted returns
Insights: Technology shows the smallest outperformance gap, suggesting that large tech companies (represented in the ETF) have been strong performers. However, equally-weighted portfolios still edge out, likely due to capturing growth from mid-cap and emerging tech companies that aren’t heavily weighted in the ETF.
Key Observations:
- Both strategies performed well in the tech sector
- EW portfolio showed more consistent growth trajectory
- Technology sector demonstrated strong overall returns regardless of weighting method
Consumer Services Sector (FTXD)
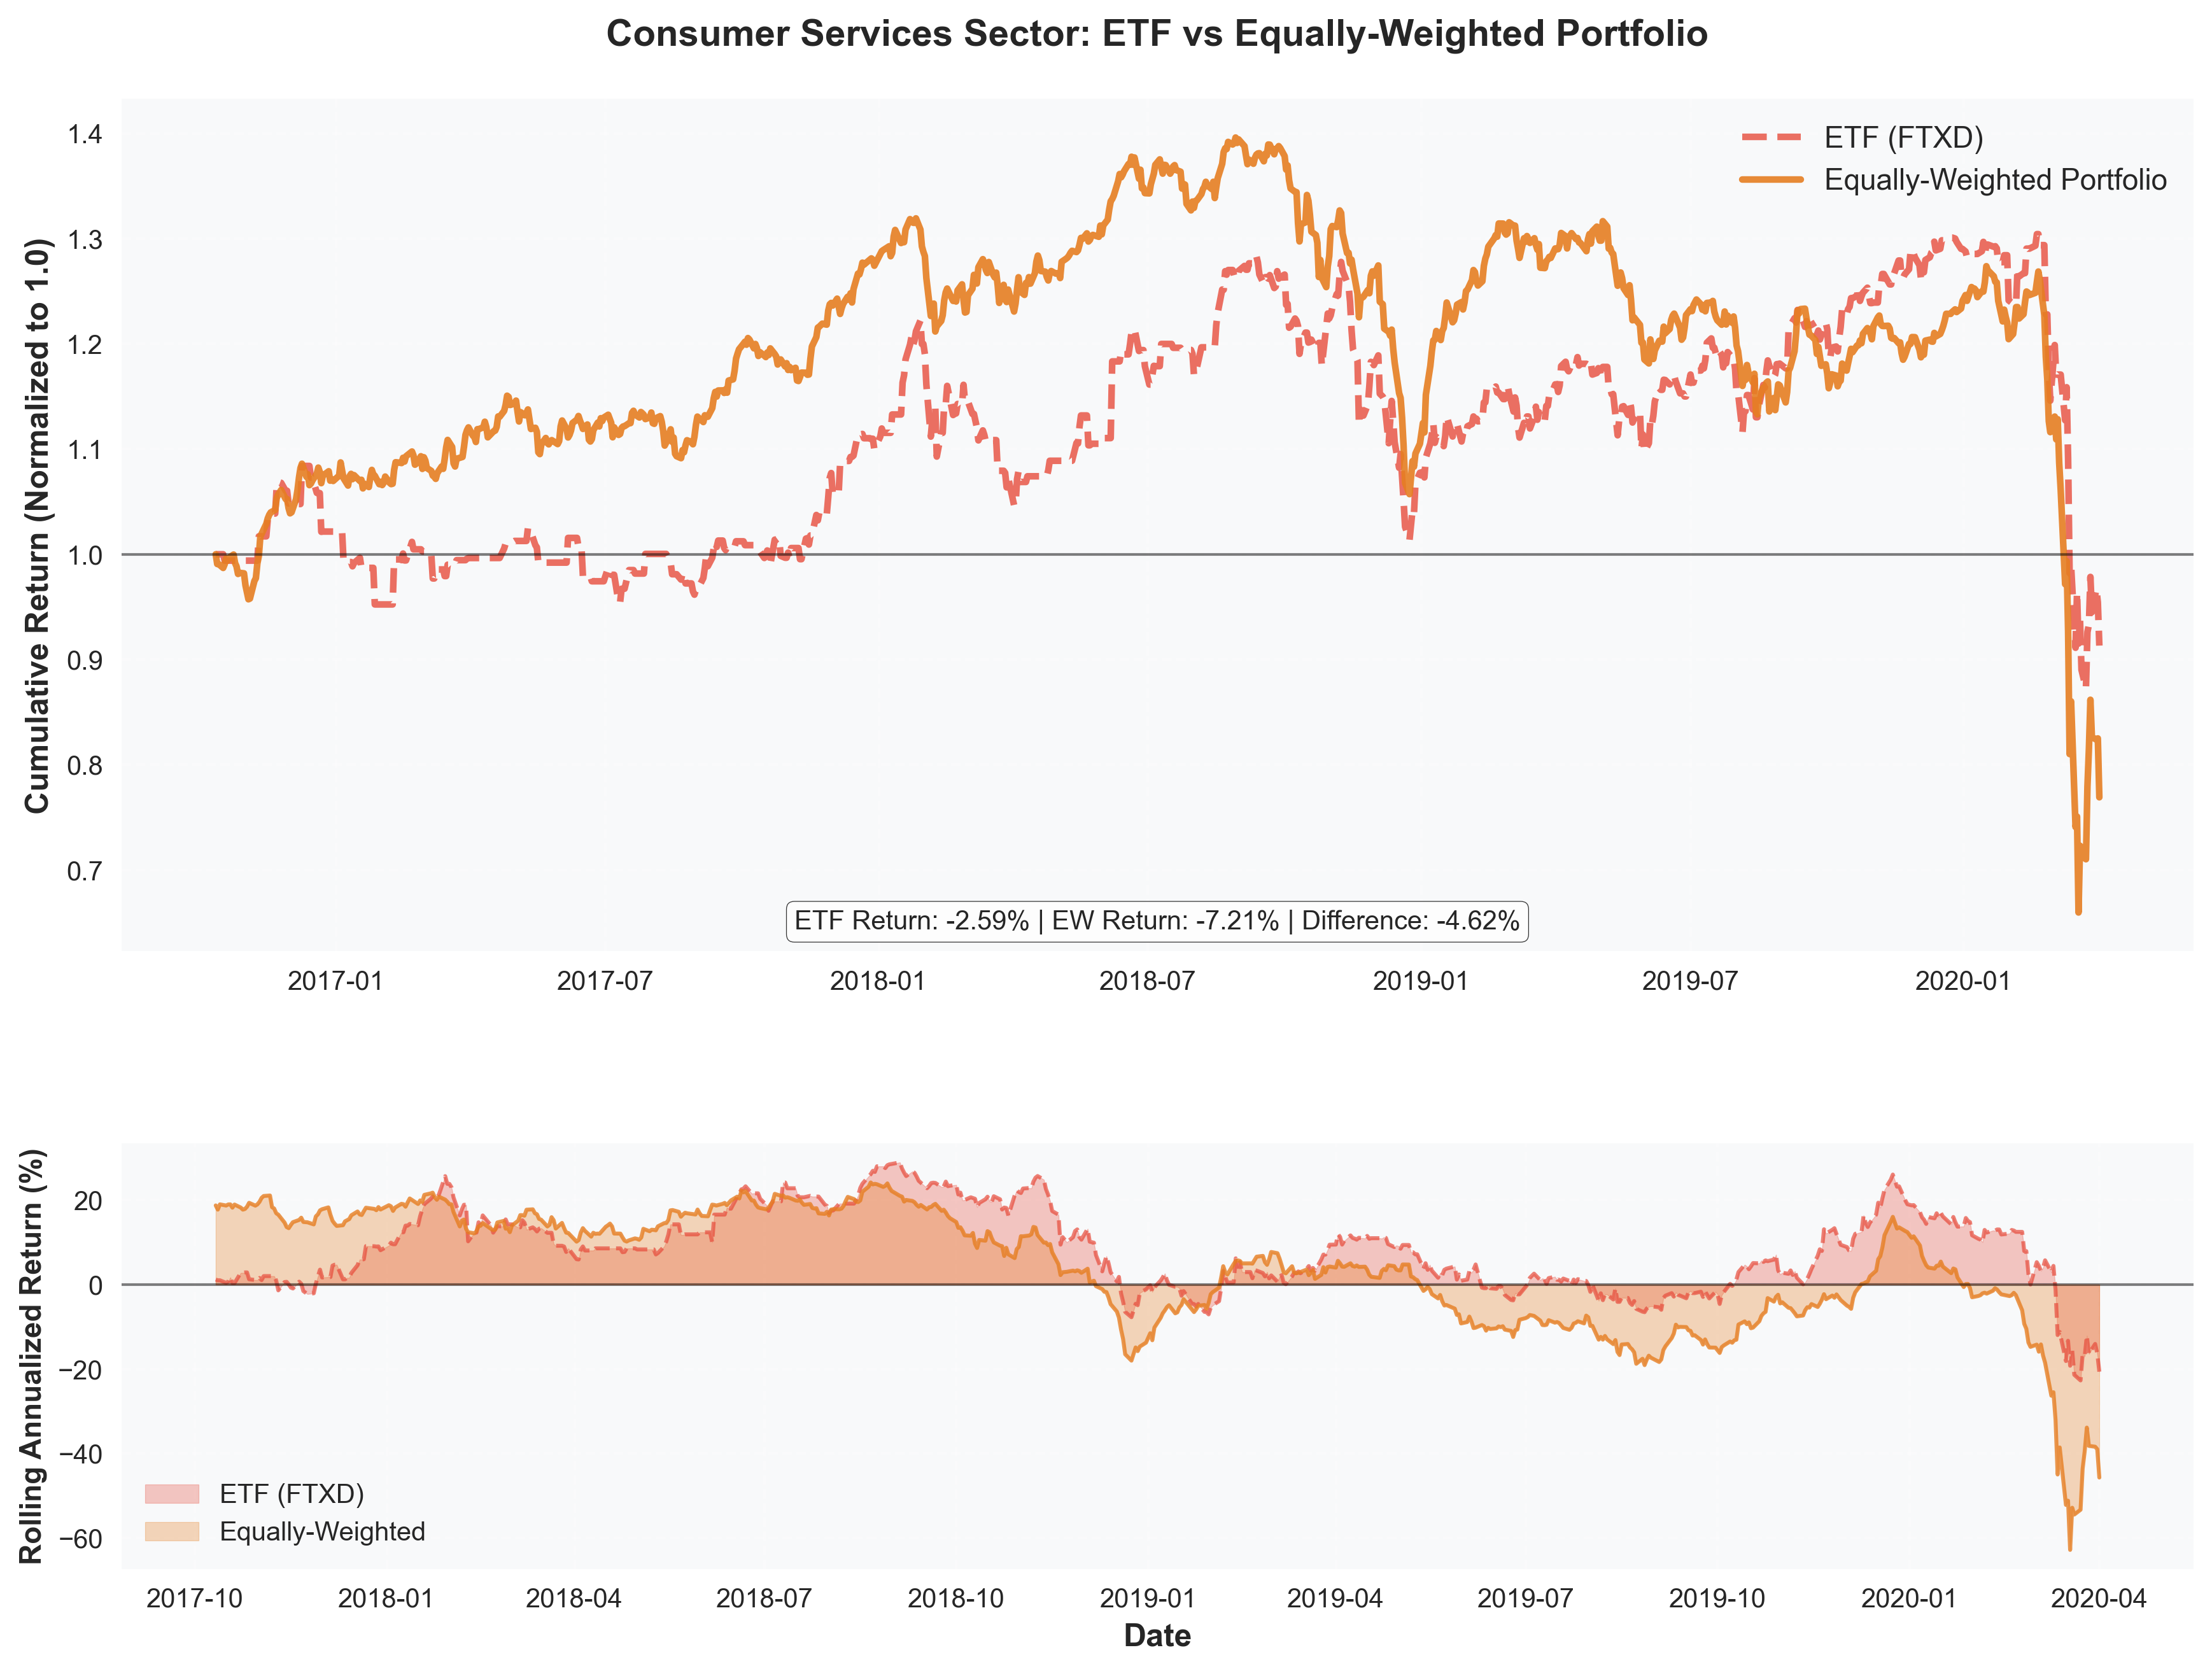
Performance Highlights:
- ETF Return: -2.59% annually
- Equally-Weighted Return: -7.21% annually
- Underperformance: -4.62% (ETF outperformed)
- Sharpe Ratio: ETF (-0.13) vs EW (-0.35) - ETF had better risk-adjusted returns
Insights: Consumer Services is the only sector where ETFs outperformed. This suggests that in this sector, market leaders (large retailers, service companies) have been more resilient than the average company. The sector faced challenges from e-commerce disruption and changing consumer preferences, where established leaders with scale advantages performed better.
Key Observations:
- Both portfolios had negative returns during this period
- ETF’s value-weighting favored resilient large-cap companies
- Sector transformation (retail disruption) may have hurt smaller companies more
- Only sector where concentration in leaders was beneficial
Sector Overview & Key Findings
Key Findings:
Equally-Weighted portfolios outperformed in 3 out of 4 sectors (75%)
| Sector | ETF Return | EW Return | Difference | Winner |
|---|---|---|---|---|
| Health Care | 9.95% | 15.99% | +6.04% | ✅ EW |
| Finance | -7.55% | 0.98% | +8.53% | ✅ EW |
| Technology | 11.43% | 12.82% | +1.39% | ✅ EW |
| Consumer Services | -2.59% | -7.21% | -4.62% | ❌ ETF |
Key Insights & Implications
1. Diversification Benefits
Equally-weighted portfolios capture returns across the entire sector spectrum, not just market leaders. This is particularly valuable in sectors with high innovation and growth potential among smaller companies.
2. Crisis Resilience
During market downturns (2008 financial crisis, 2020 COVID), equally-weighted portfolios showed superior resilience. Diversification across many companies provided protection when large-cap leaders were hit hardest.
3. Sector-Specific Dynamics
- Health Care & Finance: Strong EW outperformance suggests these sectors have significant value beyond just the largest companies
- Technology: Smaller outperformance gap indicates large tech companies are also strong performers
- Consumer Services: ETF outperformance suggests scale advantages matter more in this sector
4. Risk-Adjusted Returns
Equally-weighted portfolios generally showed better Sharpe ratios, indicating superior risk-adjusted performance. The additional volatility was more than compensated by higher returns.
5. Market Leadership Question
The results challenge the assumption that market leaders (value-weighted) always outperform. In most sectors, the “average” company (equally-weighted) delivered better returns, suggesting that:
- Market capitalization may not always reflect future growth potential
- Smaller companies can drive significant sector returns
- Diversification provides both return and risk benefits
Conclusion
This comprehensive analysis reveals that equally-weighted portfolios outperformed value-weighted ETFs in 75% of sectors analyzed over the 2005-2020 period. The findings suggest that:
-
Diversification pays off: Spreading investments equally across sector companies captures growth opportunities beyond just market leaders
-
Crisis protection: Equally-weighted portfolios showed superior resilience during market downturns
-
Sector matters: Performance varies significantly by sector, with Health Care and Finance showing the strongest EW advantages
-
Risk-adjusted superiority: Better Sharpe ratios indicate that EW portfolios provide superior risk-adjusted returns
-
Market leadership isn’t everything: Large market cap doesn’t always translate to superior returns
Global Conclusions: The Complete Market Picture
The Complete Story of Market Leadership (20 05–2020)
Our comprehensive analysis across three integrated studies reveals a fundamental tension in modern markets: size doesn't always equal strength. Here's what the data tells us.
📊 Portfolio Performance
Equally-weighted portfolios outperformed in 75% of sectors, challenging the assumption that market-cap concentration drives returns.
👑 Power Score Hierarchy
Market leaders (highest Power Scores) control significant resources, but influence is distributed differently by sector.
📈 Leadership Dynamics
Stock leadership networks show that influence flows through unexpected pathways, not always from the largest firms.
🌐 Market Structure
The market operates as a network of interconnected sectors, where diversification provides both returns and resilience.
🎯 Key Insights Across All Analyses:
- Crisis resilience matters: During downturns (2008, 2020), diversification outperformed concentration
- Regime shifts are real: 2015 marked a turning point where Big Tech dominance changed market dynamics
- Sector heterogeneity is crucial: Leaders dominate Consumer Services; Followers excel in Health Care & Finance
- Power doesn't guarantee returns: Large market cap correlates with stability but not always with growth
- Breadth beats concentration: Over 15 years, the average stock (EW) outperformed the weighted index (ETF)